Matplotlib Radarplots / Spiderplots
Radarplots
AKA spiderplots AKA Dance Dance Revolution difficulty selector
def radarplot(categories, data, colors=None, title='', fill=True, facealpha=0.1):
"""Radarplot
Parameters
----------
categories: list of str
data: dict
key: str (name)
value: np.array
- data points for each category
- Can be 1D or 2D
- rows = observations, columns=categories
colors: list of matplotlib color
- same length as data keys
title: str
fill: bool
facealpha: float
"""
theta_inc = (np.pi*2)/len(categories) # Angle between assays
# theta = np.arange(0, np.pi*2, theta_inc)
fig, ax = plt.subplots(figsize=(4, 4), subplot_kw={'projection': 'polar'}, dpi=100)
# POLAR COORDINATES
# X = theta
# Y = r (radius)
if not colors:
colors = {sample: mpl.cm.tab10.colors[i] for i, sample in enumerate(data.keys())}
if type(colors) == list:
colors = {sample: color for sample, color in zip(data.keys(), colors)}
for sample, values in data.items():
r = []
theta = []
# Cast to numpy array
if type(values) == list:
values = np.array(values)
# Cast to 2D array if 1D
if len(values.shape) == 1:
values = np.array([values])
# For each set of observations
for m in range(values.shape[0]):
# For each category
for k in range(values.shape[1]):
r.append(values[m, k])
theta.append(k * theta_inc)
c = (colors[sample])
# Reduce alpha of facecolor
fc = tuple([x for x in c] + [facealpha])
ec = tuple([x for x in c] + [1.0])
if not fill:
fc = 'none'
ax.add_patch(mpl.patches.Polygon(
np.vstack([theta, r]).T,
facecolor=fc, edgecolor=ec, linewidth=0.5
))
ax.scatter(
theta, r,
facecolor='none', edgecolor=ec, s=20,
zorder=1000 # Plot over polygon patches
)
ax.set_xticks(theta)
ax.set_xticklabels(categories)
# Place labels on the outside of the plot
# Check for left/right side of the circle
for tick in ax.get_xticklabels():
if tick._x > (np.pi/2) and tick._x < (3 * (np.pi/2)):
tick.set_ha('right')
else:
tick.set_ha('left')
# CUSTOM TICKS
#rticks = np.arange(0, 1.1, 0.2)
#ax.set_rlim([0, 1])
#ax.set_rticks(rticks)
# rgridlines, rgridlabels = ax.set_rgrids(rticks)
# for line in rgridlines:
# line.set_linewidth(0.5)
ax.set_title(title)
legend_patches = [
mpl.lines.Line2D([0], [0], color=colors[sample], marker='o', markerfacecolor='none', lw=1.)
for sample in data.keys()
]
ax.legend(legend_patches, list(data.keys()),
bbox_to_anchor=(1, 1), loc='upper left',
frameon=False, facecolor='none')
# plt.show()
return fig, ax
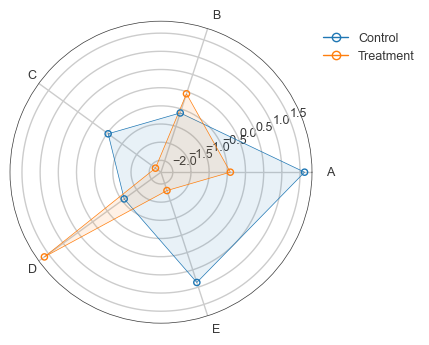
fig, ax = radarplot(
['A', 'B', 'C', 'D', 'E'],
{
'Control': norm.rvs(size=5, random_state=1),
'Treatment': norm.rvs(size=5, random_state=2)
}
)
plt.show()
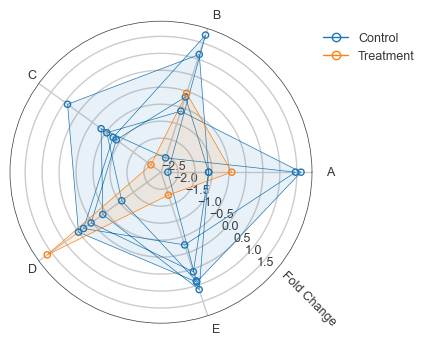
fig, ax = radarplot(
    ['A', 'B', 'C', 'D', 'E'],
    {
        'Control': np.reshape(norm.rvs(size=5*5, random_state=1), (5, 5)),
        'Treatment': norm.rvs(size=5, random_state=2)
    },

)

rlabel_pos = -1 * np.pi * (1/4)
rlabel='Fold Change'

# Radius Axis Label
if rlabel:
    ax.set_rlabel_position(np.rad2deg(rlabel_pos))
    ax.text(rlabel_pos + 0.1, 2., rlabel,
            ha='left', va='top', rotation=np.rad2deg(rlabel_pos))
plt.show()
Related Posts
← Back to home