DO-MS - Modular Mass-Spec Data Viz
[PREPRINT]
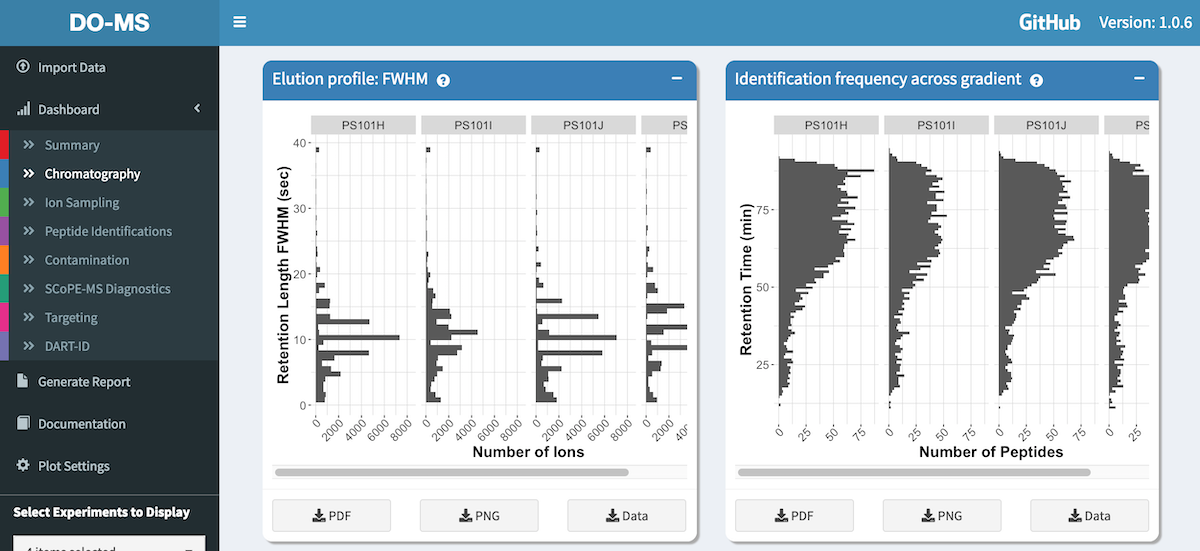
DO-MS is a modular application for visualizing and optimizing your LC-MS/MS runs. It takes in the output from MaxQuant and allows you to interactively visualize it within the app. Combine multiple experiments, filter your data, and download individual plots or data.
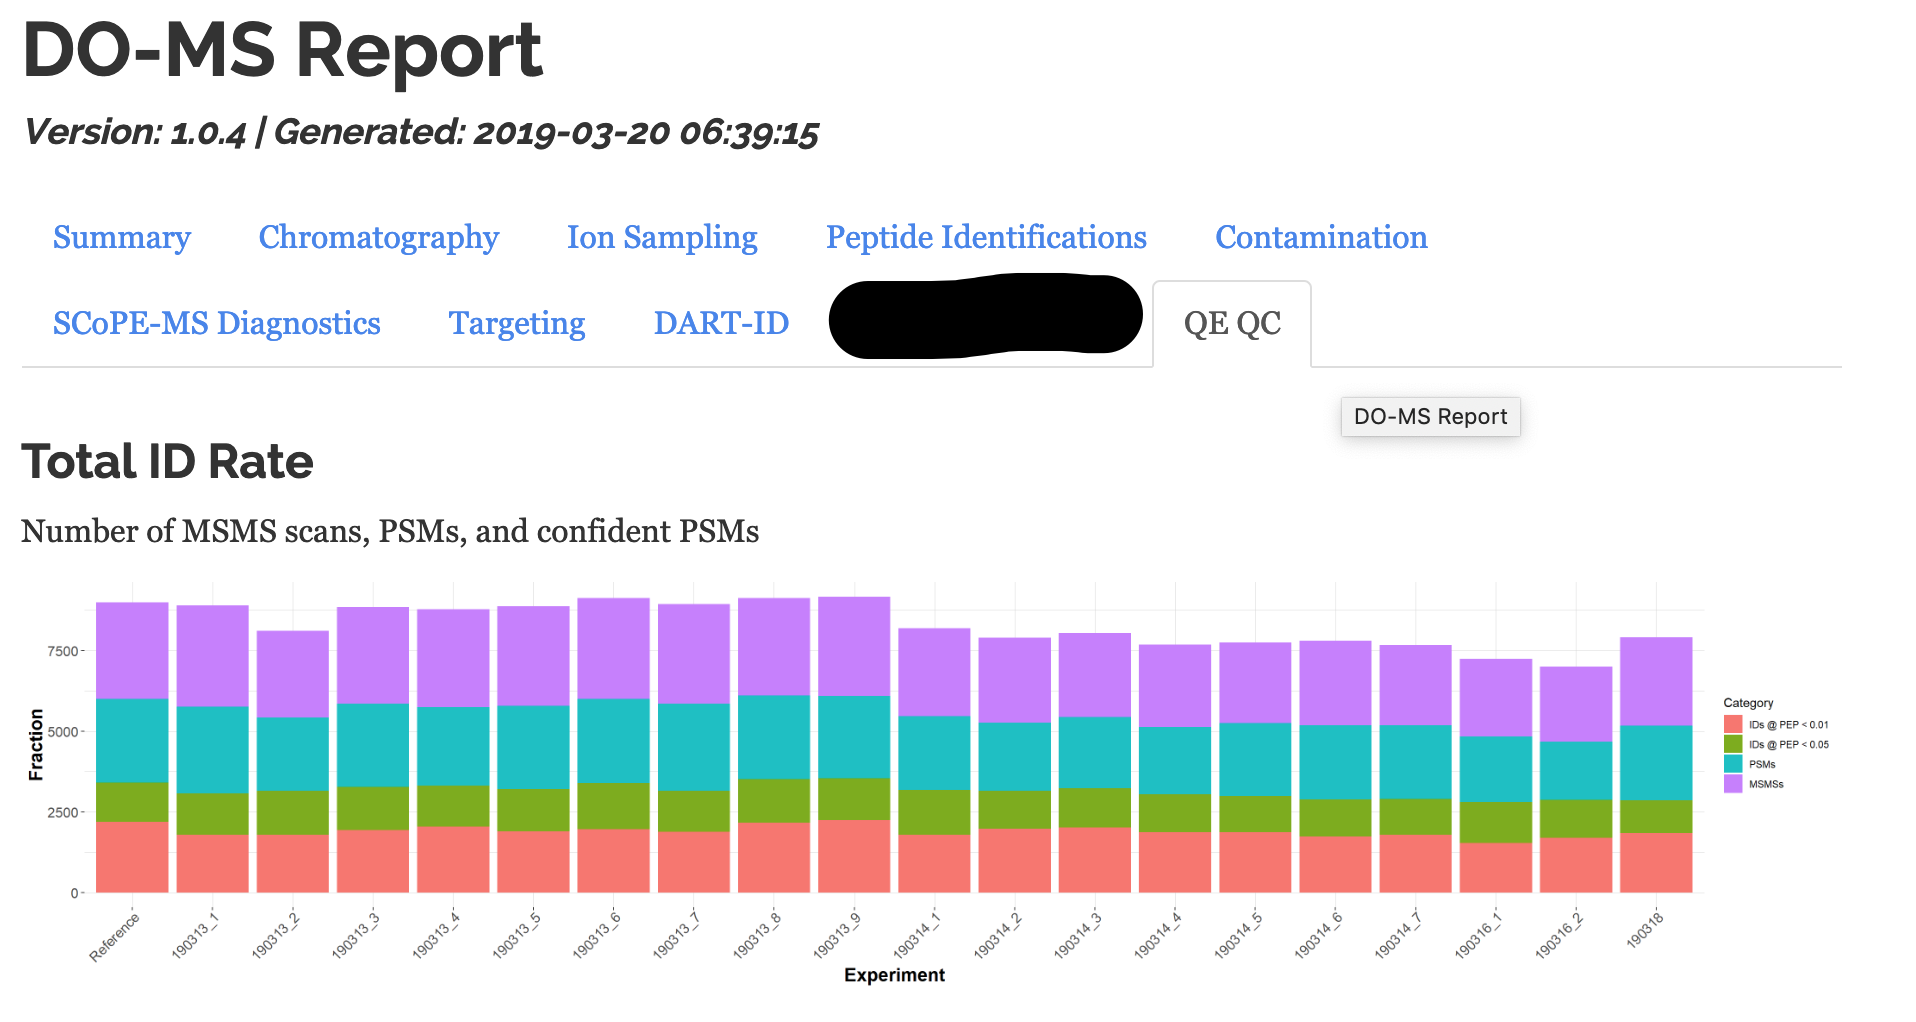
DO-MS can also generate complete reports that you can easily share with colleagues. Do this within the GUI or from the command line.
$> Rscript do-ms_cmd.R example/config_sqc68.yaml -i ~/Downloads/example_data_SQC68 -o ~/Downloads/SQC68_DO-MS_report.html --include-files SQC68D[1-3] --exp_names "250ms IT" "500ms IT" "1000ms IT"
...
Output created: ~/Downloads/SQC68_DO-MS_report.html
[1] "Report written to: ~/Downloads/SQC68_DO-MS_report.html"
[1] "Done!"
DO-MS is modular and customizable. Our lab uses an internal version with many other tabs/modules, and runs the tool every day as a quality control for our LC setup and Q-Exactive.
Involvement
My colleagues Gray and Harrison at the Slavov Lab built the first version of the application for internal use. I was brought onto the project to refactor the code, and in the process I designed the current modular system. I also led the development of both the report generation and the command-line implementation.
← Back to home