COVID CG
![]()
Visit: https://covidcg.org
Read our paper in eLife: https://doi.org/10.7554/eLife.63409
This post was written around a talk I gave to PyData Boston about COVID CG: https://www.youtube.com/watch?v=G744eRCdAYo
SARS-CoV-2 is here to stay and it’s mutating:
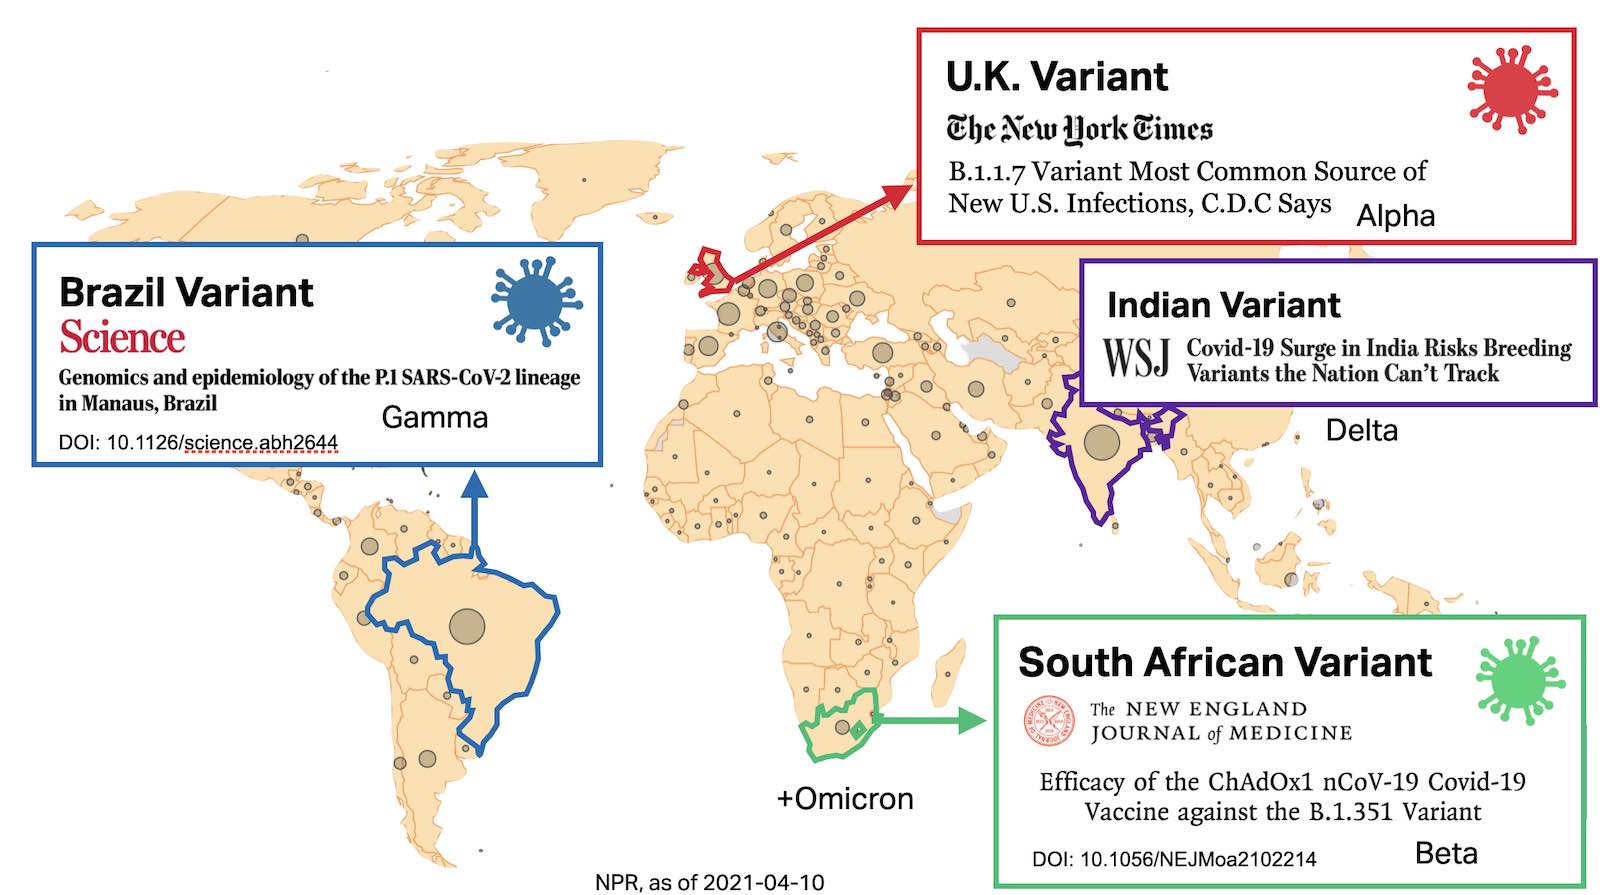
The graphic above was generated in early 2021—at that time, Delta (PANGO lineages B.1.617.*, AY.*) were on the rise, and Omicron had not yet emerged
Tracking lineages and mutations is key to combatting the COVID-19 pandemic—our pandemic response must evolve alongside the virus. The development of vaccines, therapeutics, diagnostics, and public policy all benefit from keeping on top of the latest developments in SARS-CoV-2 evolution.
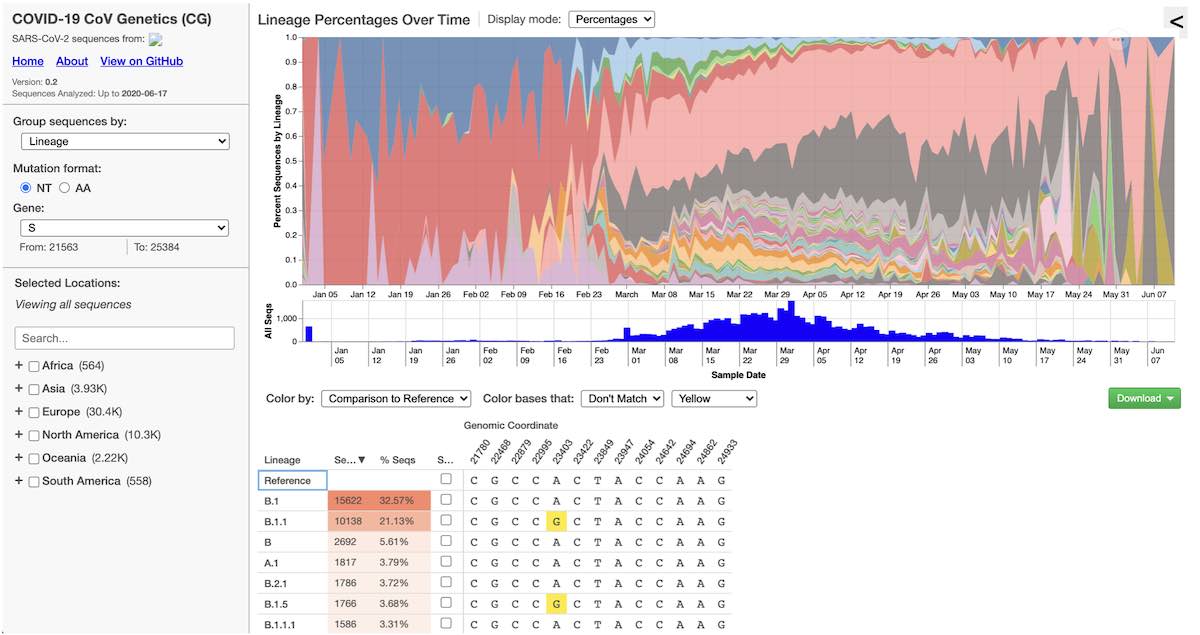
COVID CG is one of many variant tracking browsers, but it’s key differentating features are:
- Built for scientists, not the general public
- Querying mutations over millions of SARS-CoV-2 genomes
- Extensive set of filters (date, location, metadata) via a user interface, to allow for deep “drill downs” into SARS-CoV-2 mutation data
- Track global sequencing coverage (some countries sequence more than others)
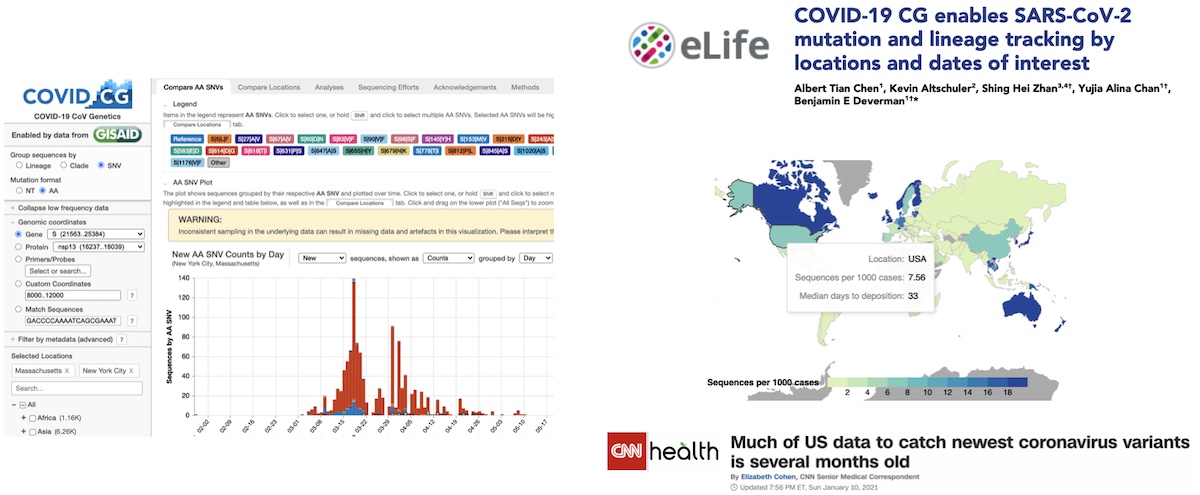
In the first year since COVID CG was launched, the site has been visited more than 47,900 times by users from 180 countries. We have fielded inquiries from AP News, CNN, WSJ, and scientists from the European Commission, Canadian government, and Australian government who are using our site to track genomic variants and global sequencing efforts. Thanks to the GISAID database, the COVID CG site is helping to make an impact on the development of COVID-19 diagnostics and therapeutics in different countries.
COVID CG continues to be a free, public resource, supported by Broad Ignite and a research collaboration with AstraZeneca.
Other great COVID-19 / SARS-CoV-2 genetics resources:
- CoVariants – variant overviews
- CoVizu – visualizing genomic diversity
- NextStrain – epidemiological reports
- outbreak.info – epidemiological reports
Use COVID CG to:
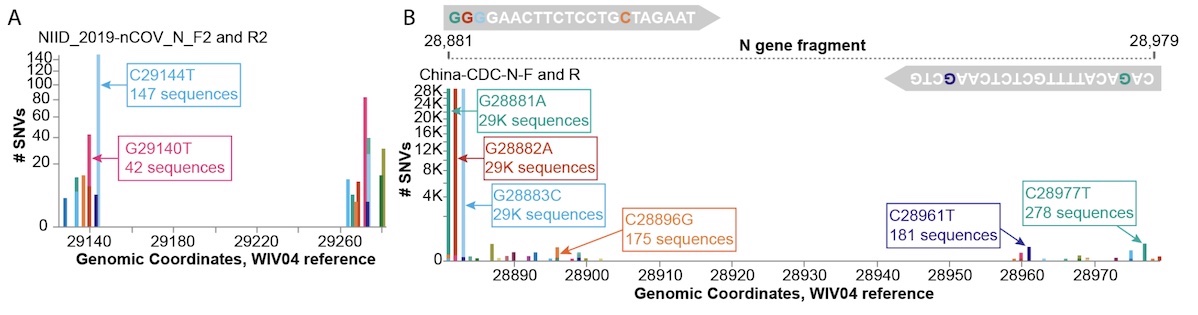
- Investigate impacts of mutations on diagnostic primers
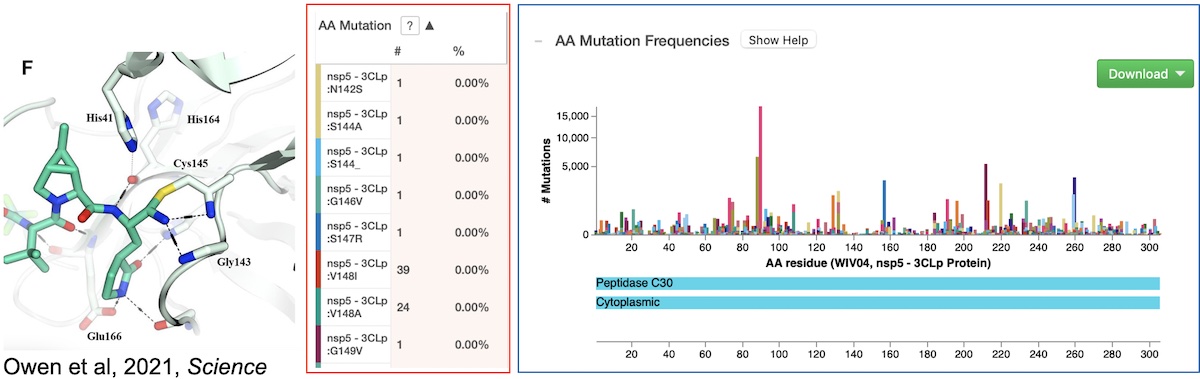
- Visualize mutations in inhibitor binding sites (3Clp inhibitor shown)
- … and more!
Technical Implementation
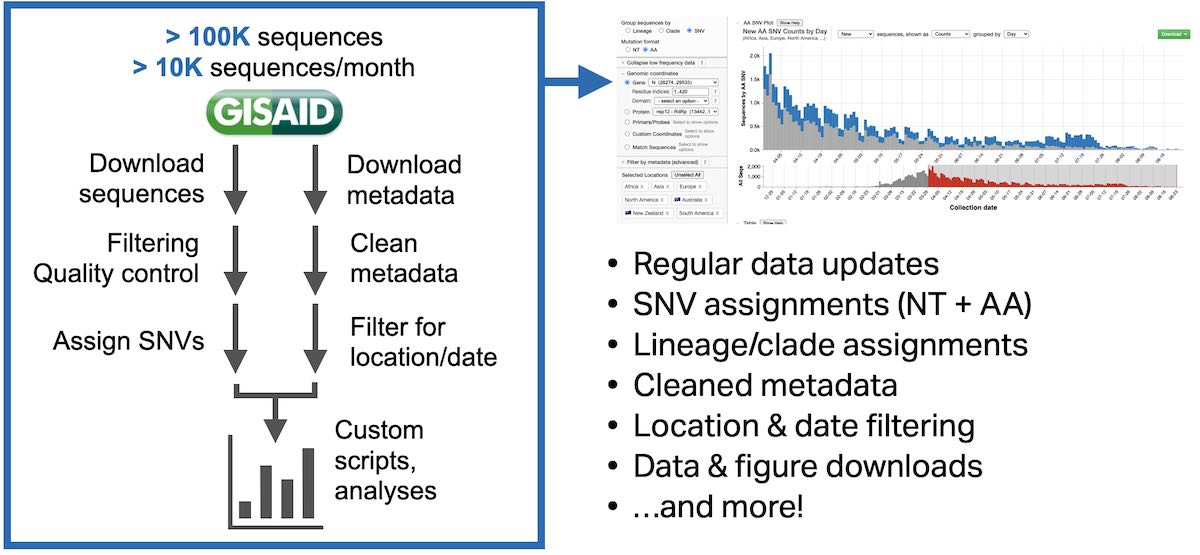
The goal of COVID CG is to accelerate SARS-CoV-2 research, by automating the process of extracting, collecting and querying mutations—and allowing researchers to explore data without writing lots of code.
For the first build of COVID CG, I had to make some key decisions as I started to build the site.
First, I decided to not use any of these “unified” solutions, such as R Shiny, Plotly Dash, or Bokeh Server. I had used some of these in the past, and while they are very easy and quick to put together, I found that I had to often hack my way around problems, and that these solutions did not scale well to very large amounts of data. Instead I started with a boilerplate kit called React Slingshot, which made all of the detailed architecture decisions for me. I decided to use React since I had worked with it extensively on some prior projects. I had also previously worked with some of the other tools listed here, and these may be very familiar to those of you that have done web development before
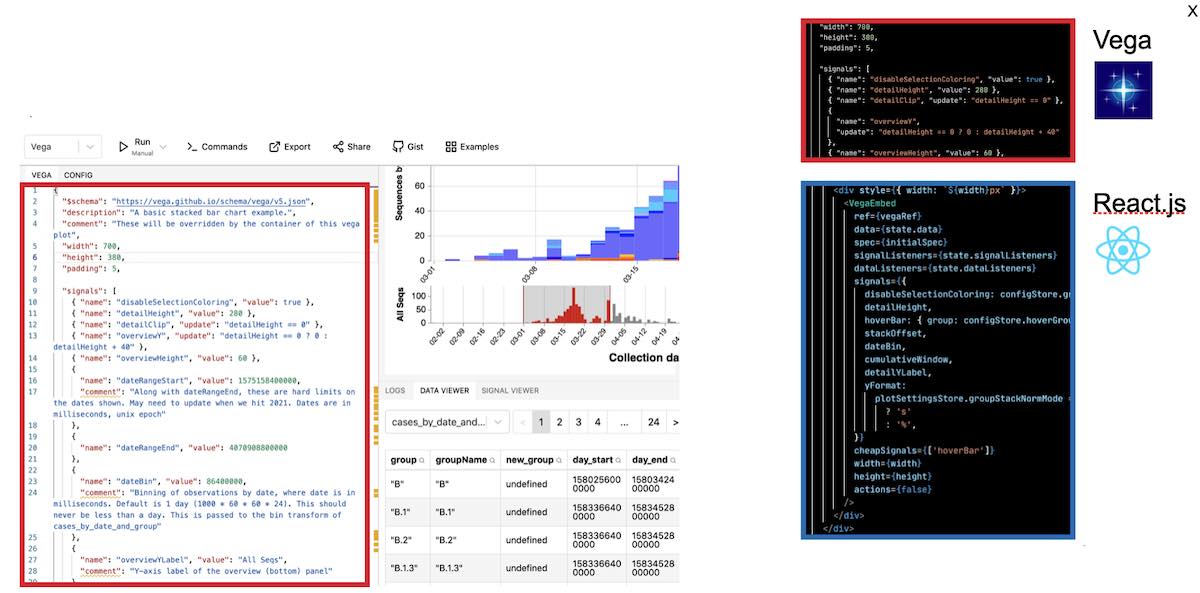
For plotting, we had a lot of options to choose from. There’s many, many javascript plotting libraries. I had Vega on my radar for a while, and decided to use it because I viewed it as more expressive than most plotting libraries, and at the same time easier to write and learn than the most expressive and customizable library: d3. Vega also had existing integration with React – although in the end I had to heavily modify this integration to suit my needs. Finally, I liked Vega because it seemed to be built from the ground up to be interactive
Vega is great because it has this online IDE (https://vega.github.io/editor/)where you can load example lots and rapidly develop your own. In addition to having a editor with live-reloading previews, it also has great debugging tools to inspect the internals of the plot. To make the plots on COVID CG, I developed here and then simply copied the JSON from the editor into our codebase. This plot could then be linked into our React app with an embed component, where we can also specify cross-interaction between our Vega plot and React
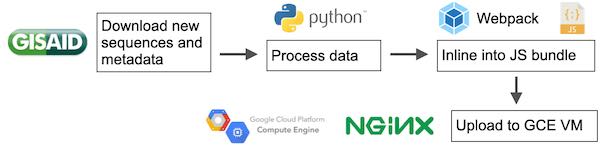
When we first started, I would have to process all data manually. Most SARS-CoV-2 genomes are deposited on GISAID, which started out as an influenza genome database but at the beginning of the pandemic was expanded to host coronavirus genomes. There’s no public API for this site, so we had to, every day, go to the site and download four files (one for sequences, three for separate sets metadata). These were stored on our local filesystems and ordered by date. Then we would manually run scripts to extract mutations from these genomes and aggregate them into one file.
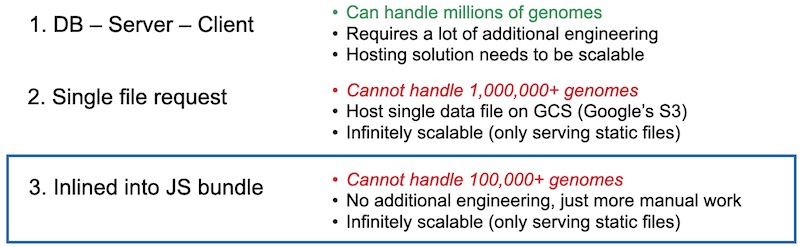
We then ran into the problem of serving this data to client browsers. Genomic data is quite large, so we couldn’t just rely on classic solutions meant for smaller amounts of data. We first considered a conventional database-server-client model. This would be the most powerful, but would also require the most work. Also, we had no idea what type of traffic we would get, so we wanted the solution to be as scalable as possible. Second, we could stuff all of our data in one big JSON file, and then host it on a static file hosting solution like Google Cloud Storage (equivalent of Amazon’s S3). This was simple, but we would also have to engineer some asynchronous requests into our Javascript application. Last, we could just inline the data directly into the bundle so that only one request was made for the entire site. This has the advantages of not having to write any request code, but the downside that we would have to rebundle and upload a new bundle every single day. We ended up going with the last solution, as it was the easiest path to a minimum viable product. We would manually download the data, manually process it, manually bundle it into javascript, and then upload that bundle to an NGINX server running on a Google Cloud VM
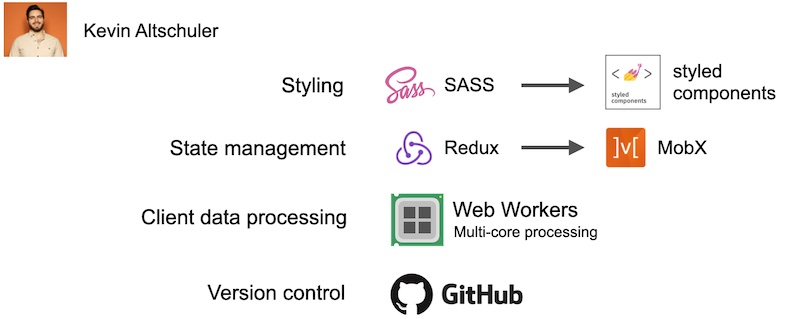
I am not a web developer by training and don’t really know what I’m doing. I don’t follow the latest trends in web technology and don’t know best practices that are employed by most big development companies. So I enlisted the help of my friend, Kevin, who is a senior web developer at a big technology company. He suggested that we replace some components of our initial boilerplate app, and put in a lot of the work to initially glue everything together. His changes were essential to the app’s development, and I’m not sure it would have even worked without his help
After all of this, we finally landed on our first functional build of COVID CG. It is very simple – it only has one plot and a table, but the scientists in our lab immediately found it useful for their research
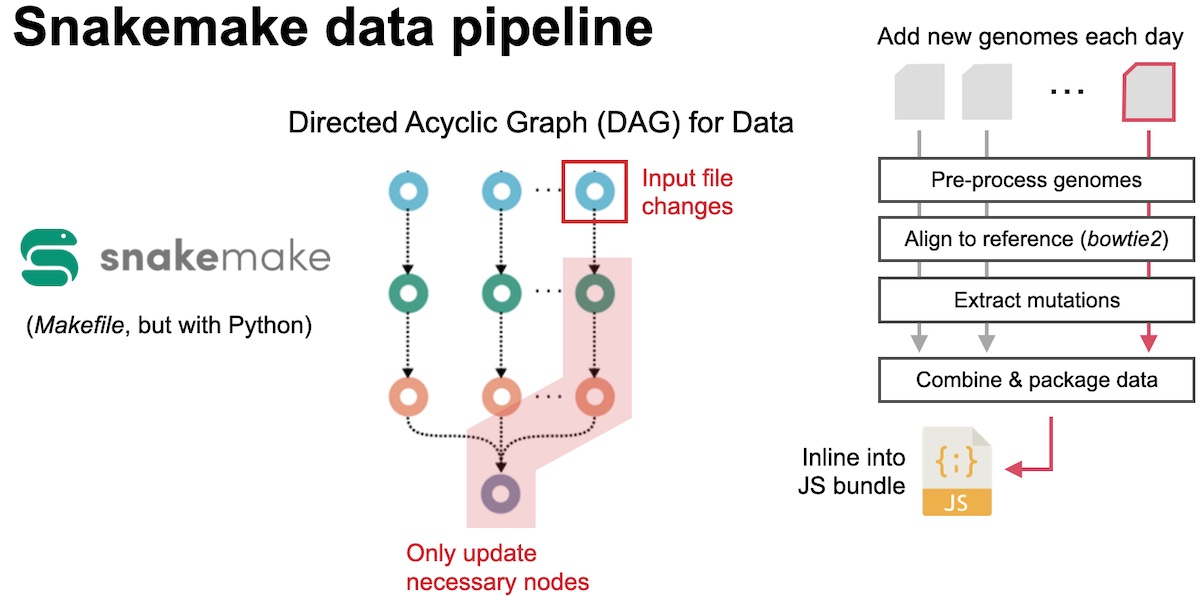
The manual data download and processing was not ideal, and our first step to automate this process was to employ snakemake, a data pipeline tool. Snakemake is the python/data science version of Makefiles that are usually used to build tools written C or C++. It builds a “dependency” graph for our data, as defined through rules that we wrote. That means that it only runs the necessary actions for processing data. For example, if one day we add a new input file, it will only process that and not reprocess any of our old data. While we still had to manually download our data, running this pipeline drastically cut down on the amount of manual work we had to do each day
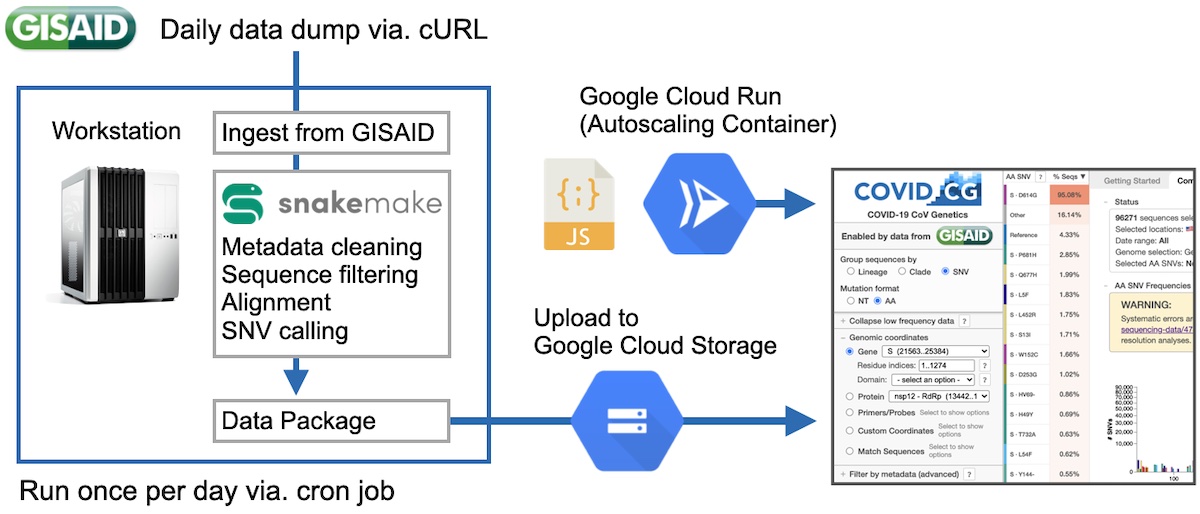
After some more development, we were eventually able to completely automate the pipeline and make it 100% hands-off. First, we were able to get access to a GISAID API, so that we no longer had to manually download files every day. We then expanded our pipeline to make calls to the API, and then after processing, automatically upload the data to Google Cloud Storage. This was all called once per day via a cron job. This bundle would then be requested by our application, so that we would no longer have to manually inline our data into our JS bundles. We moved our server from an NGINX VM on Google Cloud to a containerized deployment on Google Cloud Run. This technology automatically spins up containers in response to higher loads, which meant that we no longer had to keep any tabs on our server to make sure that it was running ok.
The design of COVID CG was heavily influenced, and much improved from the feedback of other scientists. Alina, a scientist in our group, reached out to her network of contacts and we had many users who were currently performing COVID research to try our tool and give us feedback. Much of our features stemmed from these early meetings, and it was extremely valuable moving forwards.
After months of work, we finally launched our site to the public. We also submitted a paper, which was published a few months later (https://doi.org/10.7554/eLife.63409). Surprisingly to us, the data that got the most attention, and even some news coverage, was our data collection and visualization about the sequencing effort of various countries. Over the past few months, we have been gradually fixing bugs, improving performance, and adding new features to the site
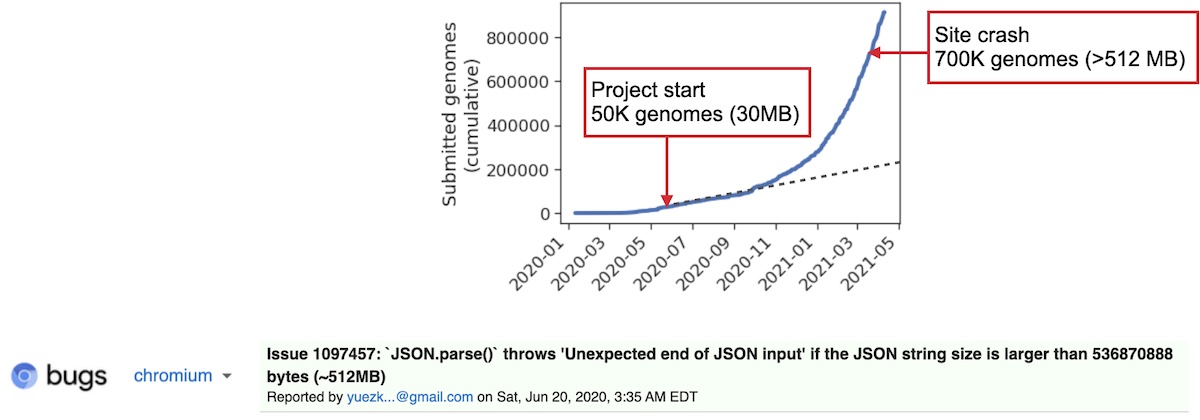
In March of 2021 I was notified that our app had stopped loading. For context, we started the app when only 50K genomes were publicly released. When we packaged this data, it came out to be about 30 MB, which when compressed went down to about 2 MB. This (relatively small) file size is a big reason for why we decided to go with our static file server solution earlier. In May/June, we figured that at the current trend of submission, that today we would have approximately 200–250K genomes. Except that the sequencing rate around the world has really skyrocketed, and we have sometimes received in 2 days more genomes than we received all the way up to May of 2020 At the time of crash, the site was sending data from over 700K genomes to our clients. Compressed, this was around 30 MB. This is a big download, but for fast internet connections it didn’t take more than a minute. Uncompressed, this data exploded to over 500 MB. Surprisingly, after checking Chrome’s task manager, I saw that our app was using less RAM than Gmail :). Anyways, after looking up our error code I found that Google Chrome refuses to parse any JSON larger than 512 MB. I was really annoyed at this arbitrary limitation at first, but honestly this is a pretty reasonable limit
Funny, since we started with the easiest solution, which broke, then we moved up, then that broke, then we ended up at the hardest solution – to build a server.
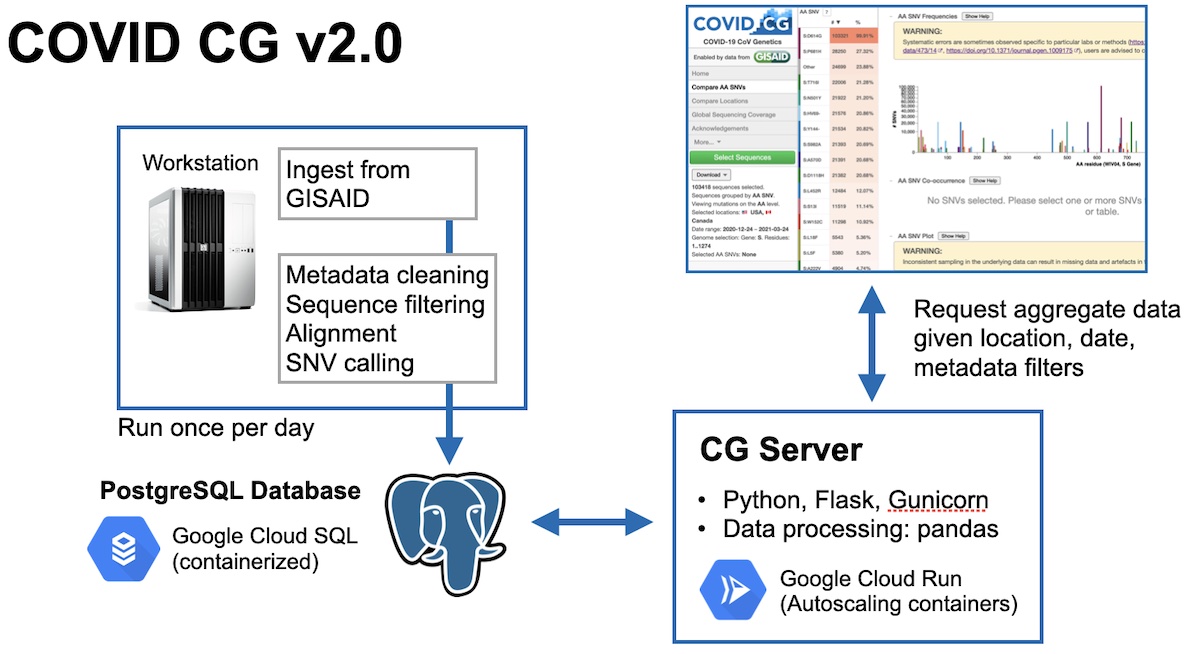
I had actually already been working on this build for a while since I had anticipated that the volume of data would eventually take too long to load. But I hadn’t anticipated that it would break outright. This bug forced me to prematurely push up this developmental build. The data processing was still automated and run daily, except now instead of uploading one big bundle to Google Cloud Storage, we were instead populating a PostgreSQL database We wrote our server in Flask, and handled data processing with the pandas library. This server has an API exposed that our front-end could use to request certain subsets of aggregated genomes, instead of all the data at once
When I started this I was sort of on the side of that programmer meme, where a programmer goes: I can do this manually in 5 minutes, or automate it in 4 hours. I wanted to put up a site as quick as possible so I just did everything manually. But having to go through every day really did add up. I wish I had timed myself doing my daily manual tasks the first week that I started, because then I would realize that automating it from the beginning would be a very worthwhile investment. Asking for help was great. I had done web development before, but I needed to be honest with myself and just accept that I could not do this alone. Kevin, the senior web developer, really pointed us in the right technical directions, and the feedback we got from scientists and other stakeholders was crucial for pointing us in the right scientific directions. Lastly, we have had a lot of problems with scalability. Of course, we were laser-focused on getting something – anything out, as this was an emergency response. But we got a lot more traffic than we anticipated, and scaling correctly from the beginning would have, again, saved us a lot of time in maintenance and putting out fires.
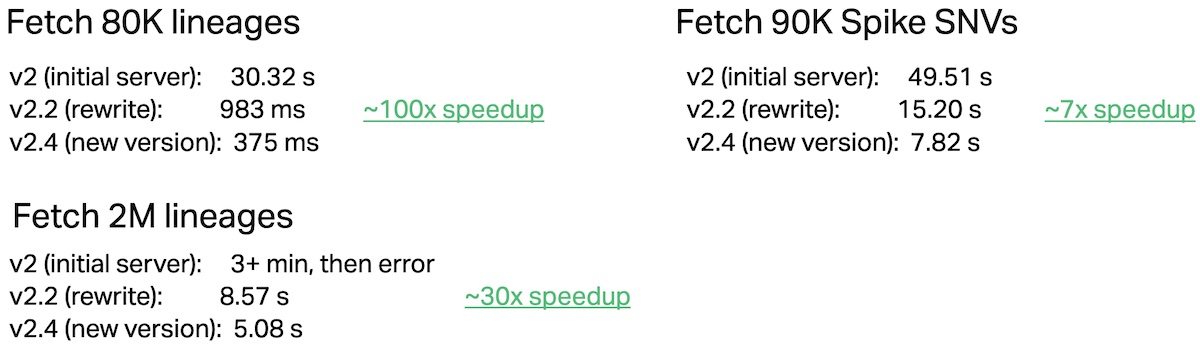
Most recently, I’ve been working on performance and flexibility improvements, and trying to get query times down as the data keeps on increasing (we’re almost at 9M genomes and 100M+ mutations as of the date of writing this…). Most of these performance improvements are low hanging fruit in Postgres—reducing the number of joins, table partitioning, etc. I may write a post on that later, if I have the time :)
← Back to home